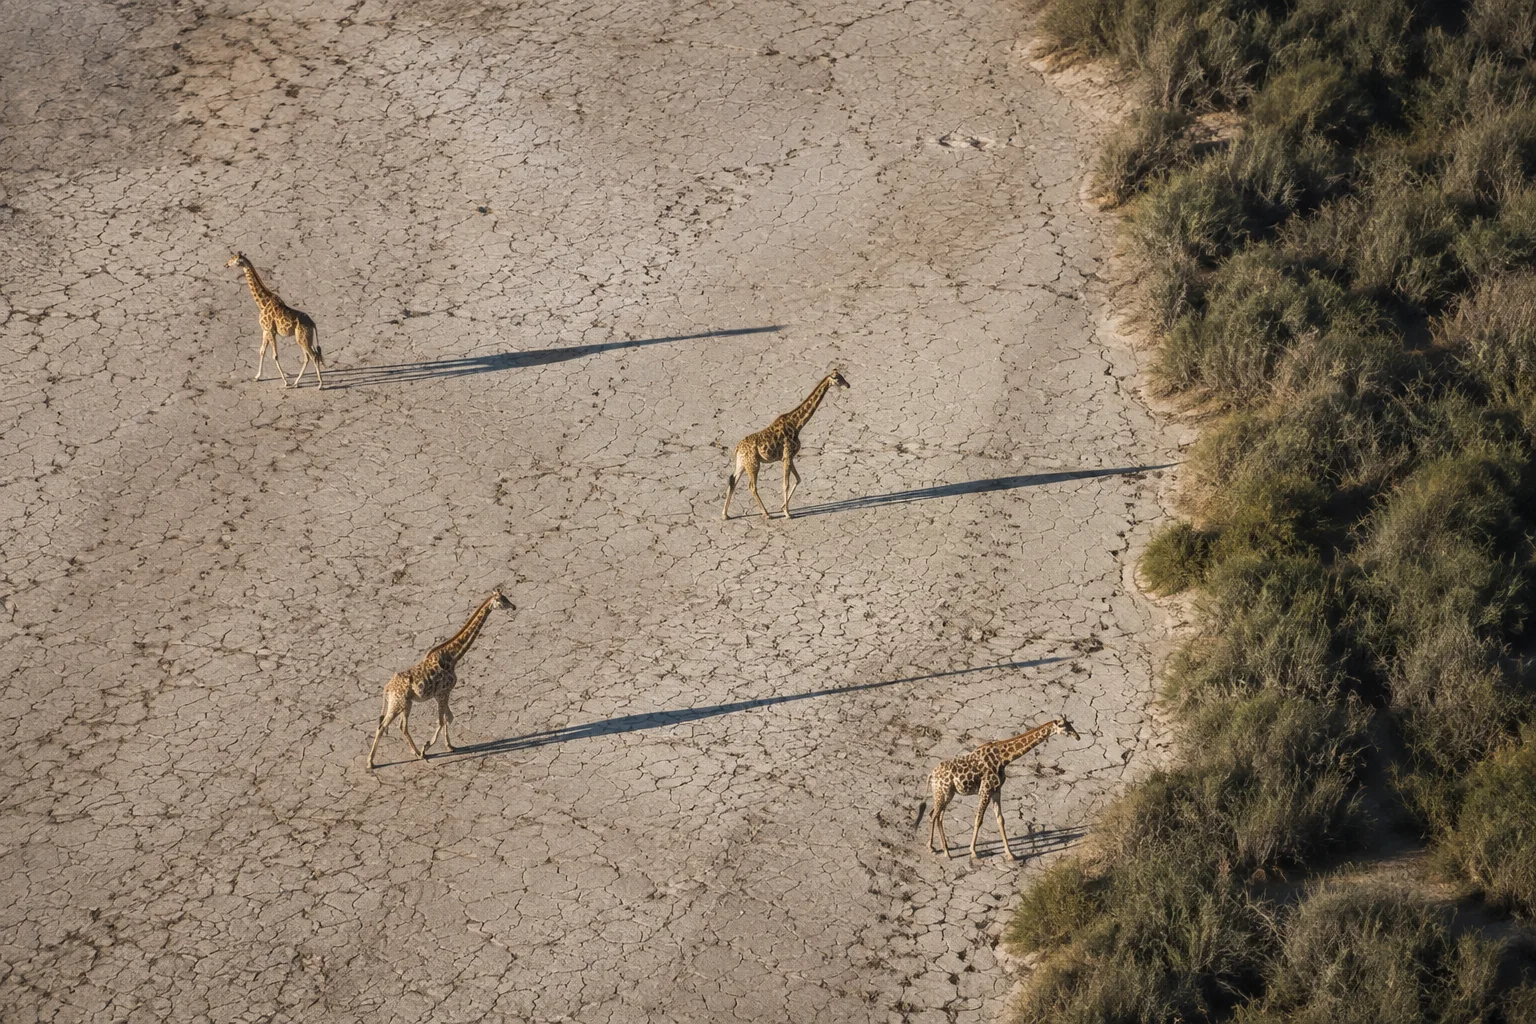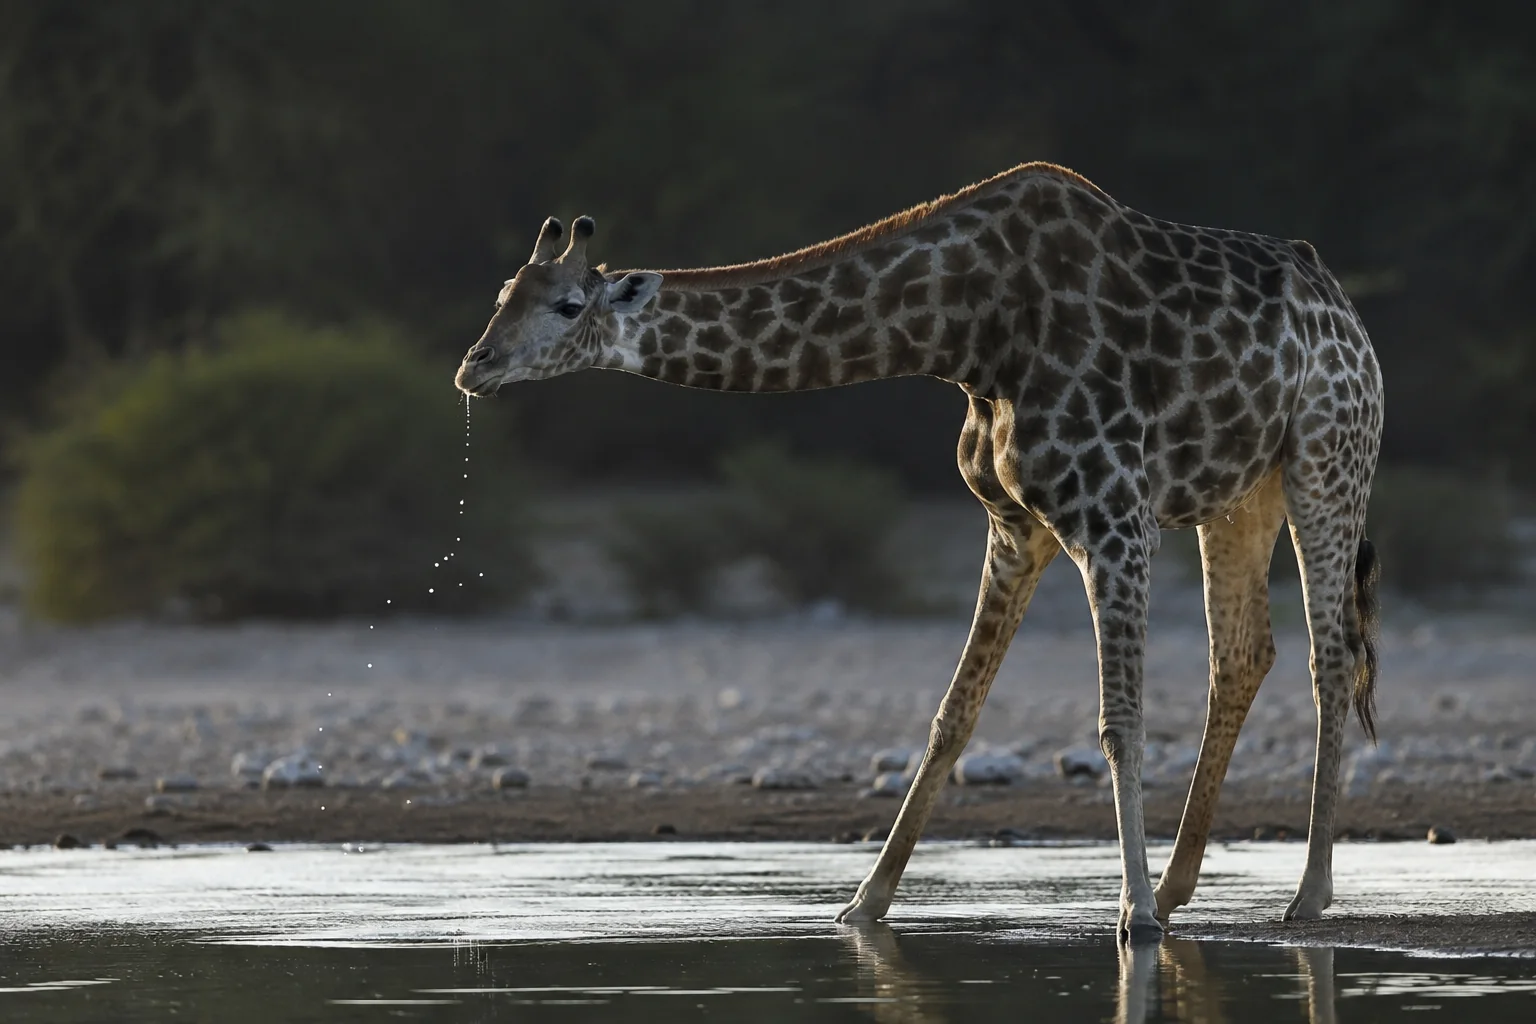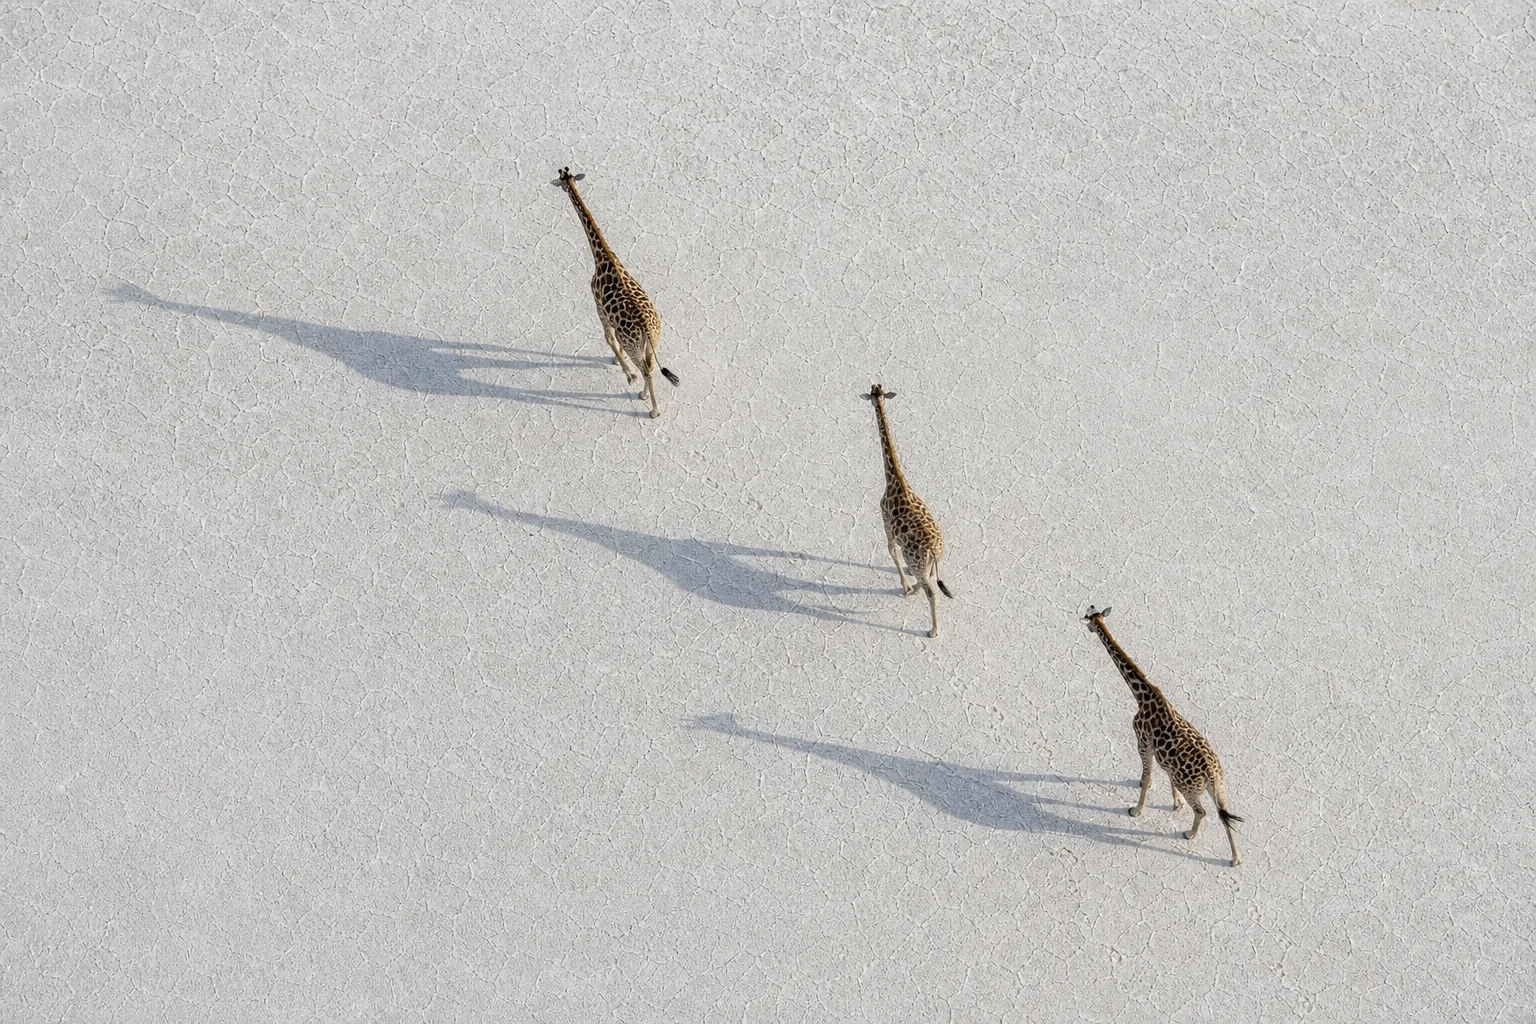
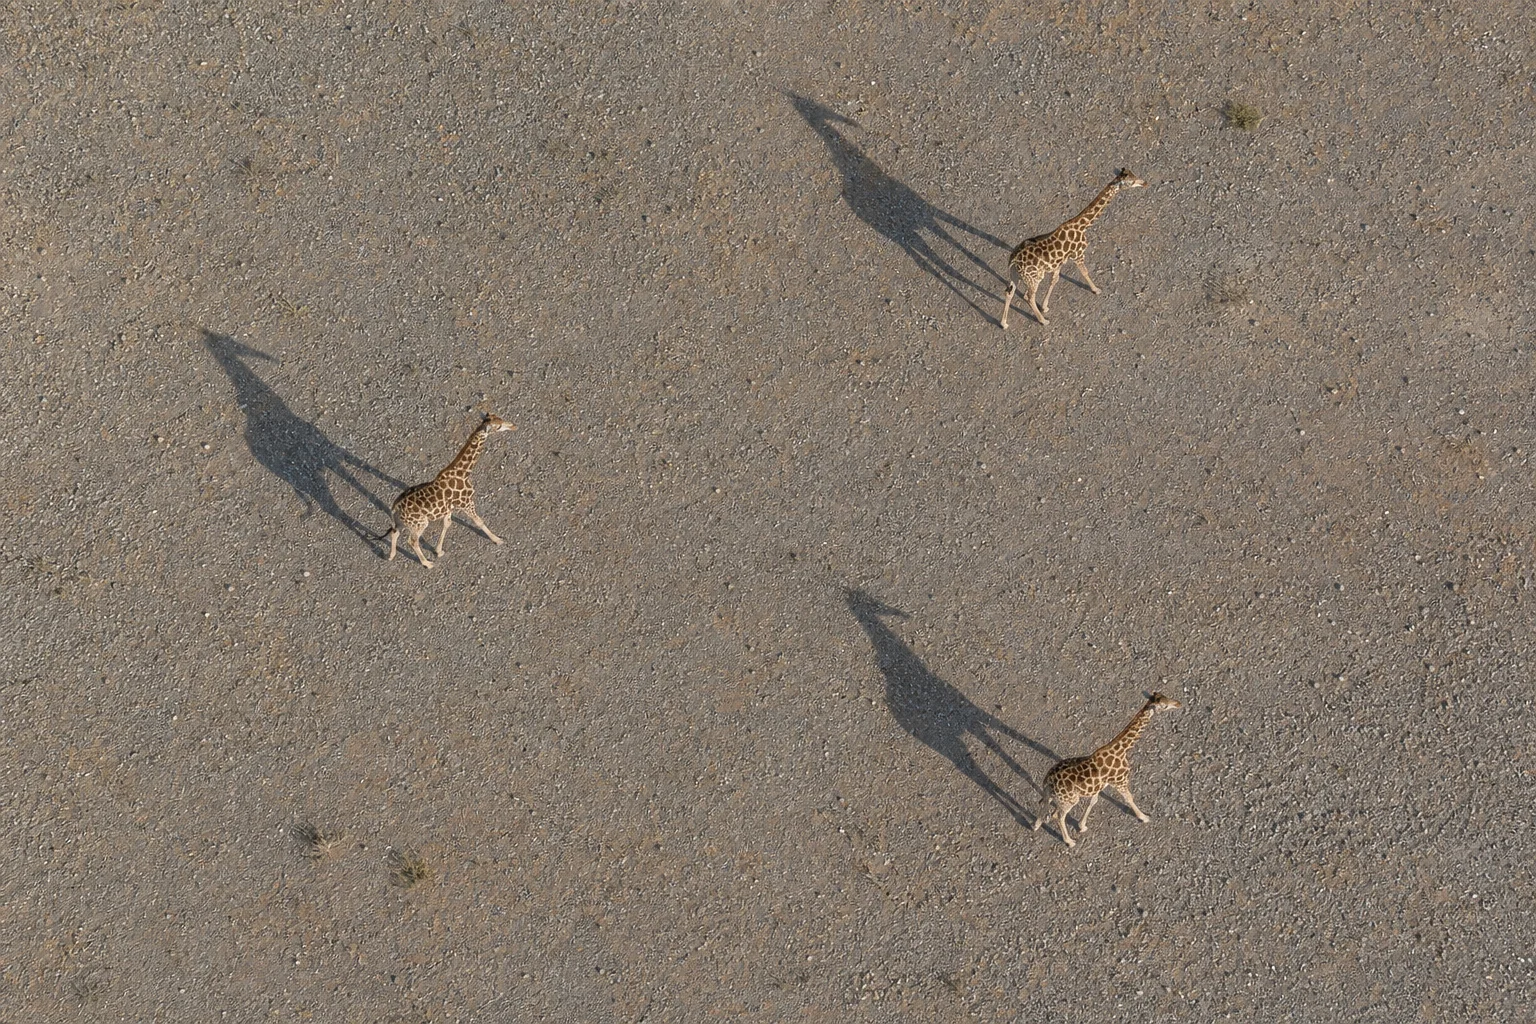
A survey finds more giraffes than the last one. Is that recovery, or did researchers search farther and miss fewer animals? The distinction matters: an improved estimate can be valuable news without proving population growth. To judge the result, we need to know how sightings became a number—and which animals never had a realistic chance of being counted.
What does counting giraffes actually measure?
Researchers use ground and aerial observations, photographs of identifiable animals, and statistical models to estimate giraffe abundance. The important distinction is between what was recorded and what is inferred. A GPS tag adds movement information; it does not turn a sample of tagged animals into a population census.
Three numbers can appear in the same study without contradicting one another: the number of encounters, the number of distinct giraffes recognized, and the estimated population including animals not encountered. A giraffe photographed on three days contributes three encounters but only one identity. An abundance model then asks what those encounter histories imply about unseen animals.
This explains why how many giraffes are left cannot be answered by adding every sighting. It also helps distinguish a newly documented population from biological growth when reading State of Giraffe 2025.
Match the method to the question
“Aerial survey” describes where observers work. “Distance sampling” or “capture–recapture” describes how observations are analysed. These are not mutually exclusive alternatives: photographs collected from a vehicle can supply individual histories, while an aircraft can carry observers and cameras together.
| Approach | What the records contain | What they can establish | Essential caution |
|---|---|---|---|
| Direct ground or aerial count | Animals observed during a defined search | A tally within the surveyed area and period | Searching everywhere is not the same as seeing everything |
| Line-transect distance sampling | Sightings, effort and distances from survey lines | Density or abundance with a detection model | Representative routes and detection assumptions matter |
| Photographic capture–recapture | Confirmed identities across repeat visits | Abundance from individual encounter histories | Wrong matches and unequal encounter chances can distort results |
| Spatial capture–recapture | Identities plus encounter locations and search effort | Density and abundance for a defined region | Spatial coverage and model boundaries constrain inference |
| GPS tracking | Repeated positions of tagged individuals | Movement and space use | A track is not a count of untagged neighbours |
The studies below demonstrate these distinctions. The first question should therefore be “What quantity do we need?” rather than “Which technology looks most advanced?” A population estimate, a distribution map and a measure of survival require different evidence.
What ground and aerial surveys can miss
Distance sampling: measure the observation process
In line-transect distance sampling, observers record animals and their perpendicular distances from a survey line. The distribution of those distances helps estimate how detection changes away from the line. Conventional analysis assumes that animals on the line are detected; distances must be reliable and observations must represent animals' initial positions. Survey lines also need a defensible spatial design. These principles are explained by the method developers in Thomas and colleagues' distance-sampling paper.
The practical question for a reader is whether roadside observations represent the landscape being described. A beautifully fitted detection curve cannot, by itself, tell us what happens in habitat the survey never meaningfully sampled. Ask to see the route design alongside the statistical result.
Aerial cameras: a useful check, not perfect vision
Lamprey and colleagues' Tsavo study, published in 2020, compared airborne cameras and live observers viewing the same survey strips in 2017. After adjusting for image-reader detection, the authors estimated that live observers missed 60% of available giraffes. “Available” matters: this was not proof that cameras detected every animal hidden by vegetation.
The images could be revisited and checked, but human interpretation still missed animals. The authors also cautioned against transferring corrections between environments, seasons or observer teams. The lesson is not to multiply every aerial count by a standard factor; it is to investigate detection under the conditions of that survey.
How photographs become a population estimate
Separate images, identities and encounter histories
Photo-ID uses recognizable natural markings to connect observations of the same animal. In Bolger and colleagues' photographic mark–recapture system, software ranked candidate matches for human checking. Researchers could then assemble individual encounter histories. A missed match can falsely split one giraffe into two identities and inflate estimated abundance; a software suggestion is therefore not sufficient evidence of identity.
The biology of giraffe coat patterns makes this approach possible, but the analytical unit is the verified animal, not the photograph. More pictures are useful only when their quality, identity and survey context are retained. A database with thousands of images is not automatically a census.
The Luangwa example: observed animals versus estimated abundance
In a 2025 study of Zambia's Luangwa giraffes, Sun and colleagues used road-based photographic surveys from August–November 2023. After identification checks and exclusions, 439 detections represented 277 different adults and subadults. Spatial capture–recapture connected identities, locations and survey effort to estimate a median abundance of 760, with a 95% Bayesian credible interval of 651–890.
Calves were excluded from the model because their encounters were not independent of accompanying adult females. This was therefore not an all-age census, and 760 was not the number photographed. The survey also extended beyond the previously mapped southern distribution, complicating direct comparisons with older estimates.
This case shows why a population figure needs its age scope, observation dates, study boundary and uncertainty attached. A larger estimate following a broader search cannot, on its own, demonstrate that births outpaced deaths. Our Luangwa research commentary traces the survey exclusions, expanded coverage and comparison with the earlier estimate.
Which survey method performed best in a direct comparison?
Lee and Bond's 2016 comparison covered four sites in Tanzania's Tarangire ecosystem. Six ground surveys in 2012 collected distance-sampling and photographic capture–recapture data together; aerial estimates came from November 2011. The comparison focused on adults. Photo-ID estimates were the most precise, but distance and photo-ID estimates differed significantly at two sites.
That result is useful without making photo-ID a universal winner. The ground routes followed roads, the aerial survey occurred earlier, and the true population was not independently known. The authors themselves warned that their aerial corrections could overestimate numbers when extended across varying habitats and densities.
For a reader choosing between competing estimates, methodological disagreement is a reason to inspect design—not simply select the larger number or average everything together. Check whether both studies describe the same habitat and geographic range, age classes and period before asking which is more convincing.
Why GPS tracks and camera records are not headcounts
A tracking dataset may contain many positions from relatively few animals. Brown and colleagues' 2023 pan-African study analysed 148 giraffe trajectories from 22 sites after filtering. Its outputs described home ranges and daily movements, not population abundance. Tracking devices were fitted mainly to females, and the analysis excluded trajectories that did not meet its duration and range-residency criteria.
Tracking can help frame questions about where a survey should look and whether its boundary makes biological sense. But an empty patch on a map of tagged animals does not establish an absence of untagged giraffes. Likewise, movements of sampled individuals should not automatically be described as movements of every animal in their population.
Camera traps, ranger logs and public photographs deserve the same distinction between a record and an inference. Ten records could depict ten animals or repeated visits by one. To evaluate a proposed abundance estimate, ask how repeat observations, identity, search effort and detection were handled. A useful presence record need not answer every population question; its value lies in answering the question it can support.
A small example: more sightings, no population growth
Consider an entirely hypothetical area containing exactly 100 giraffes. Between two surveys, no animals are born, die, enter or leave. For this deliberately simplified illustration, stipulate that the first search detects 60% of those animals and the second detects 80%.
| Invented survey | Distinct giraffes seen | Stipulated fraction detected | Simple arithmetic correction |
|---|---|---|---|
| First | 60 | 0.60 | 60 ÷ 0.60 = 100 |
| Second | 80 | 0.80 | 80 ÷ 0.80 = 100 |
The observed count rose by 20 animals: (80 − 60) ÷ 60, or about 33%. The population did not change. Only the fraction observed changed.
In real work, researchers do not conveniently know either the true population or the realized detection fraction. They estimate detection under a survey design, with uncertainty. This arithmetic is not a replacement for capture–recapture or distance sampling; it simply isolates why a change in sightings need not equal a change in abundance. It is not a reanalysis of any study above.
There is an important reverse lesson, too: an unchanged tally does not necessarily prove a stable population. Different combinations of abundance and detection can yield the same count. The survey must provide enough information to distinguish those explanations.
How to read uncertainty and compare surveys
Precision is not the same as accuracy
Precision concerns how tightly an estimate is constrained; accuracy concerns how close it is to the quantity being estimated. A narrow interval does not guarantee that poorly sampled habitat, mistaken identities or an inappropriate model have been resolved. Conversely, a wide interval is useful information about what a study cannot yet distinguish.
Read the label on an interval. Confidence intervals and Bayesian credible intervals have different statistical interpretations; neither should be relabelled a minimum and maximum number physically counted. A credible interval summarizes uncertainty conditional on the model and its assumptions, not every possible source of error outside them.
A trend needs a comparable population
Before treating two numbers as evidence of change, check:
- Who: the same taxon and age classes, including whether calves were excluded.
- Where: matching boundaries, surveyed habitat and treatment of unsurveyed areas.
- When: observation years, seasons and survey duration—not only publication dates.
- How: comparable effort, detection treatment and identity checking.
- What uncertainty: the estimate and its interval, with a method for evaluating change.
If a later survey adds a new area, ask for a comparison within the shared area as well as the new total. If a method changes, a documented comparison or calibration can be more informative than a seamless-looking graph joining incompatible points. Such checks help separate population and demographic evidence from a change in our ability to observe it.
Even a defensible increase does not establish its cause. Claims that protection or another intervention produced it need evidence about that intervention and plausible alternative explanations. This is the additional step in assessing whether giraffe conservation works.
What to remember
- Keep encounters, identified animals and estimated abundance separate.
- Read a number with its survey period, geographic boundary, age scope and detection method.
- Treat GPS movement records as a different kind of evidence from headcounts.
- Compare like with like before calling a larger estimate recovery.
Population size is also only one part of the picture. Questions about young giraffes or social structure need evidence about the animals and processes involved, not just a regional total.
Frequently asked questions
Why not simply count every giraffe from an aircraft?
Covering an area does not guarantee seeing every animal in it. Visibility and observation conditions still matter. A claimed total count should explain how missed animals and possible duplicate observations were assessed.
Does photographic capture–recapture require catching giraffes?
Not for the photographic identification step. “Capture” refers to recording an identifiable animal, and “recapture” to recognizing it again. Any handling for separate tagging work is a different procedure.
Is a higher estimate good news?
It may document more animals than previously known. Whether it demonstrates growth depends on comparable coverage, timing, detection and uncertainty. Better knowledge and biological recovery are both meaningful, but they are not interchangeable claims.
Which method should I trust most?
Prefer the estimate whose design fits the question and whose assumptions are visible. No technology removes the need to define the population, check records and assess uncertainty. A combination of methods can answer complementary questions without producing interchangeable numbers.
Sources
The links beside the relevant claims lead to the six papers used here. For further context, the research library connects population monitoring with other giraffe evidence.
- Thomas et al. (2010), Distance software: design and analysis of distance sampling surveys for estimating population size.
- Bolger et al. (2012), A computer-assisted system for photographic mark–recapture analysis.
- Lee and Bond (2016), Precision, accuracy, and costs of survey methods for giraffe Giraffa camelopardalis.
- Lamprey et al. (2020), Comparing an automated high-definition oblique camera system to rear-seat-observers in a wildlife survey in Tsavo, Kenya.
- Brown et al. (2023), Ranging behaviours across ecological and anthropogenic disturbance gradients: a pan-African perspective of giraffe (Giraffa spp.) space use.
- Sun et al. (2025), First rangewide density estimate of the endemic and isolated Luangwa giraffe in Zambia.