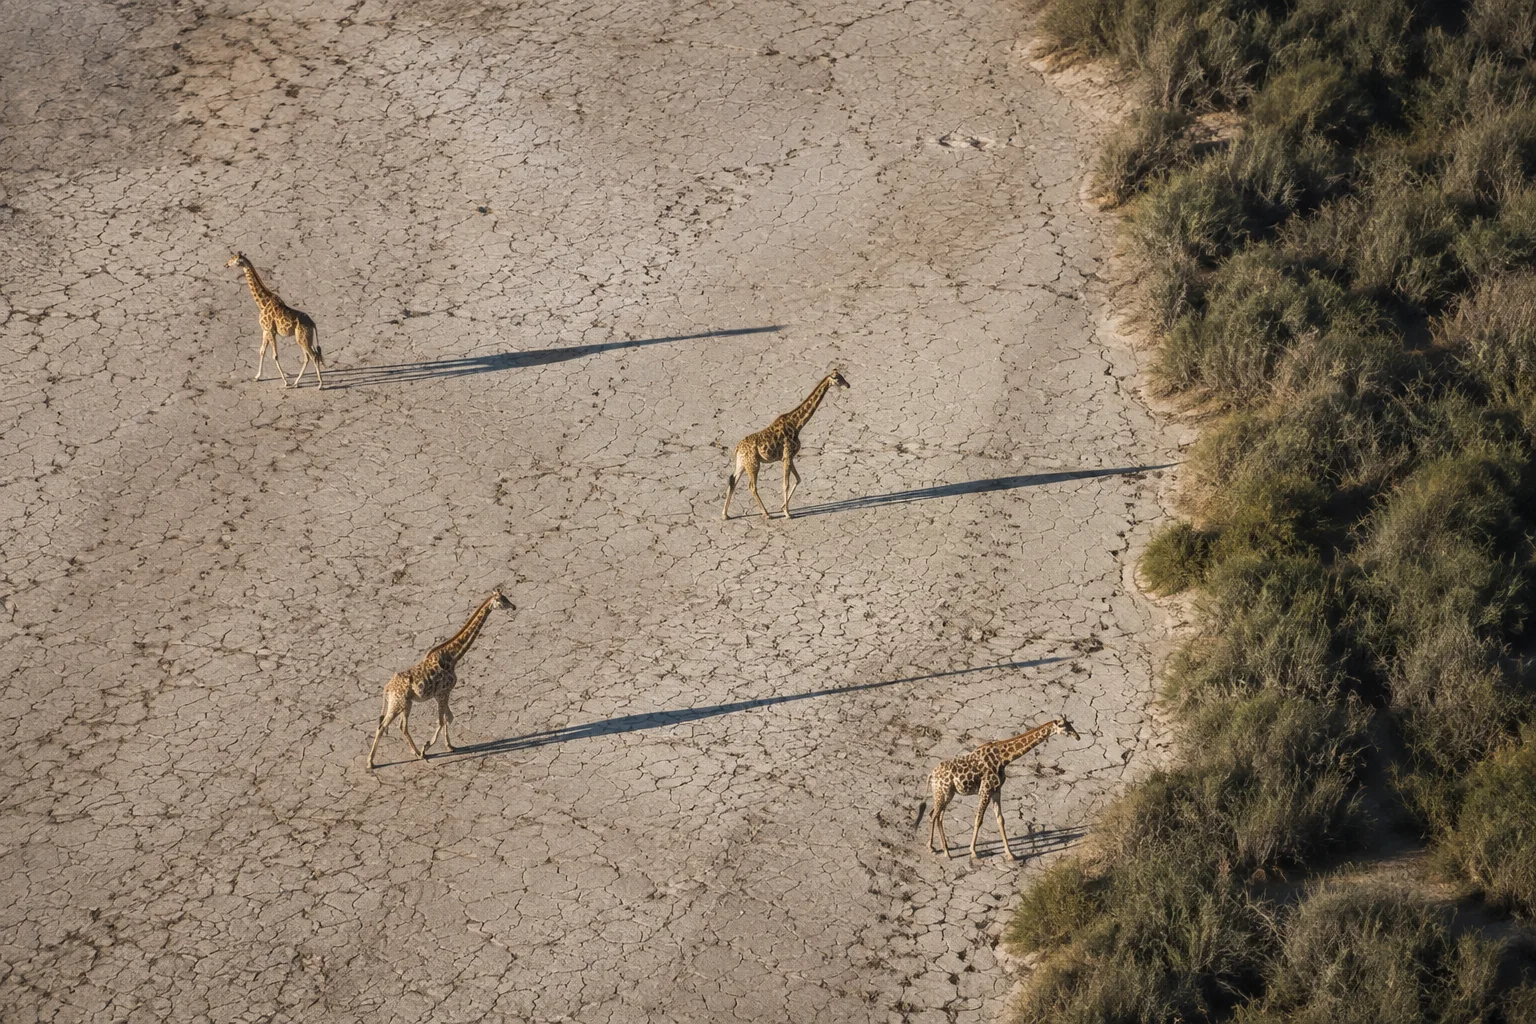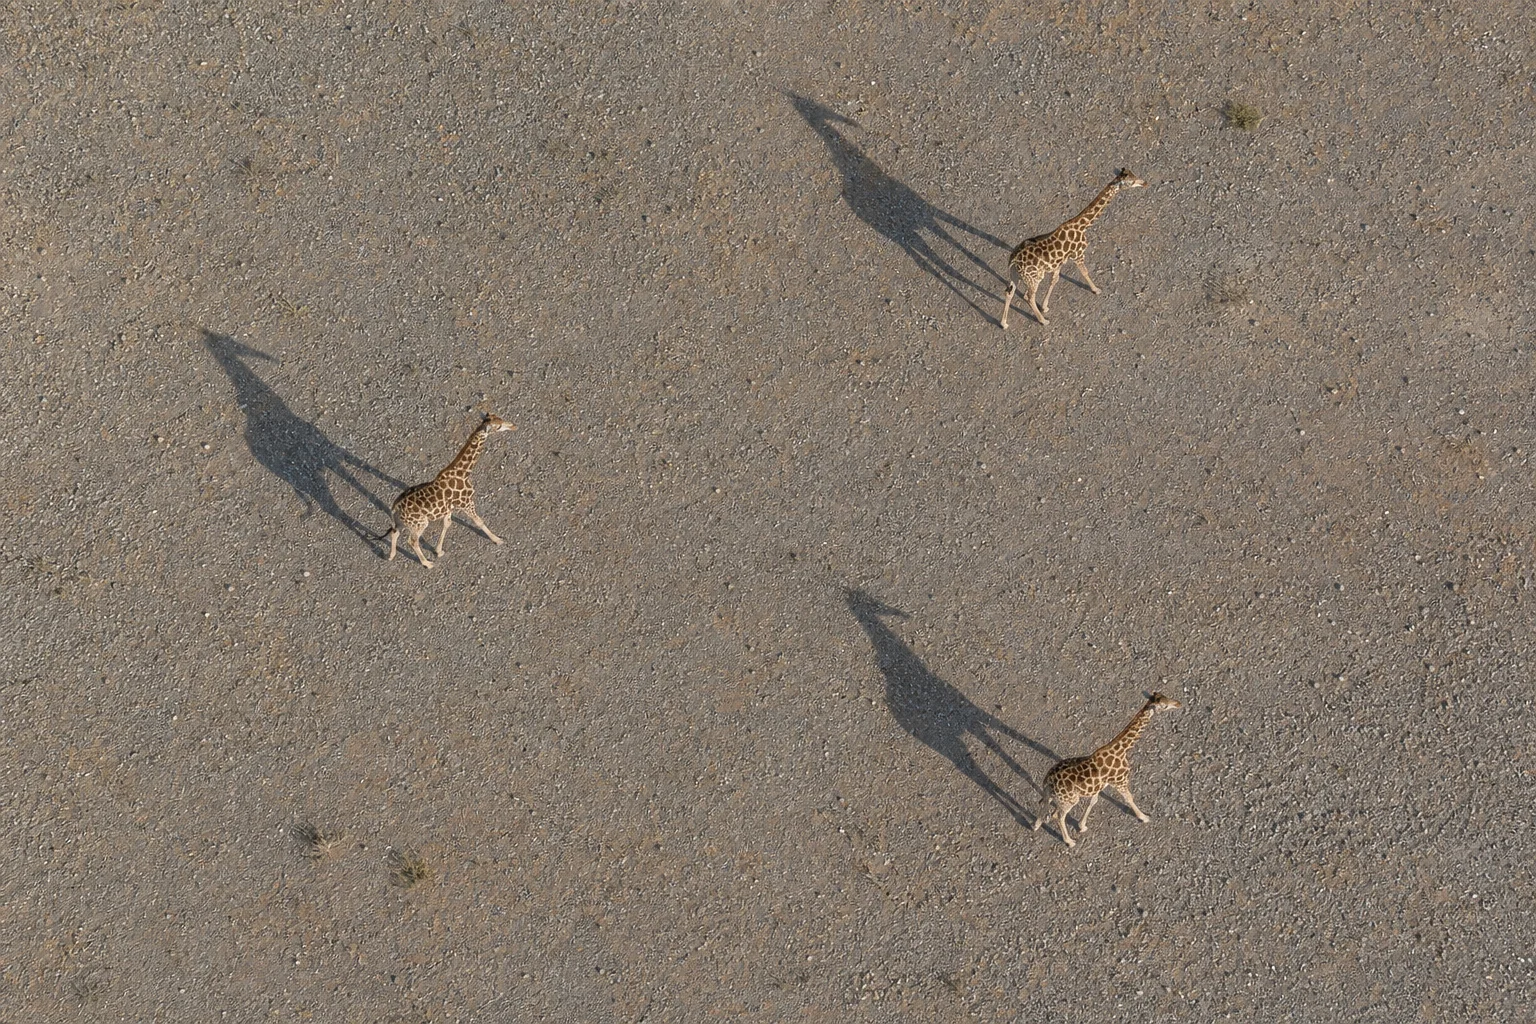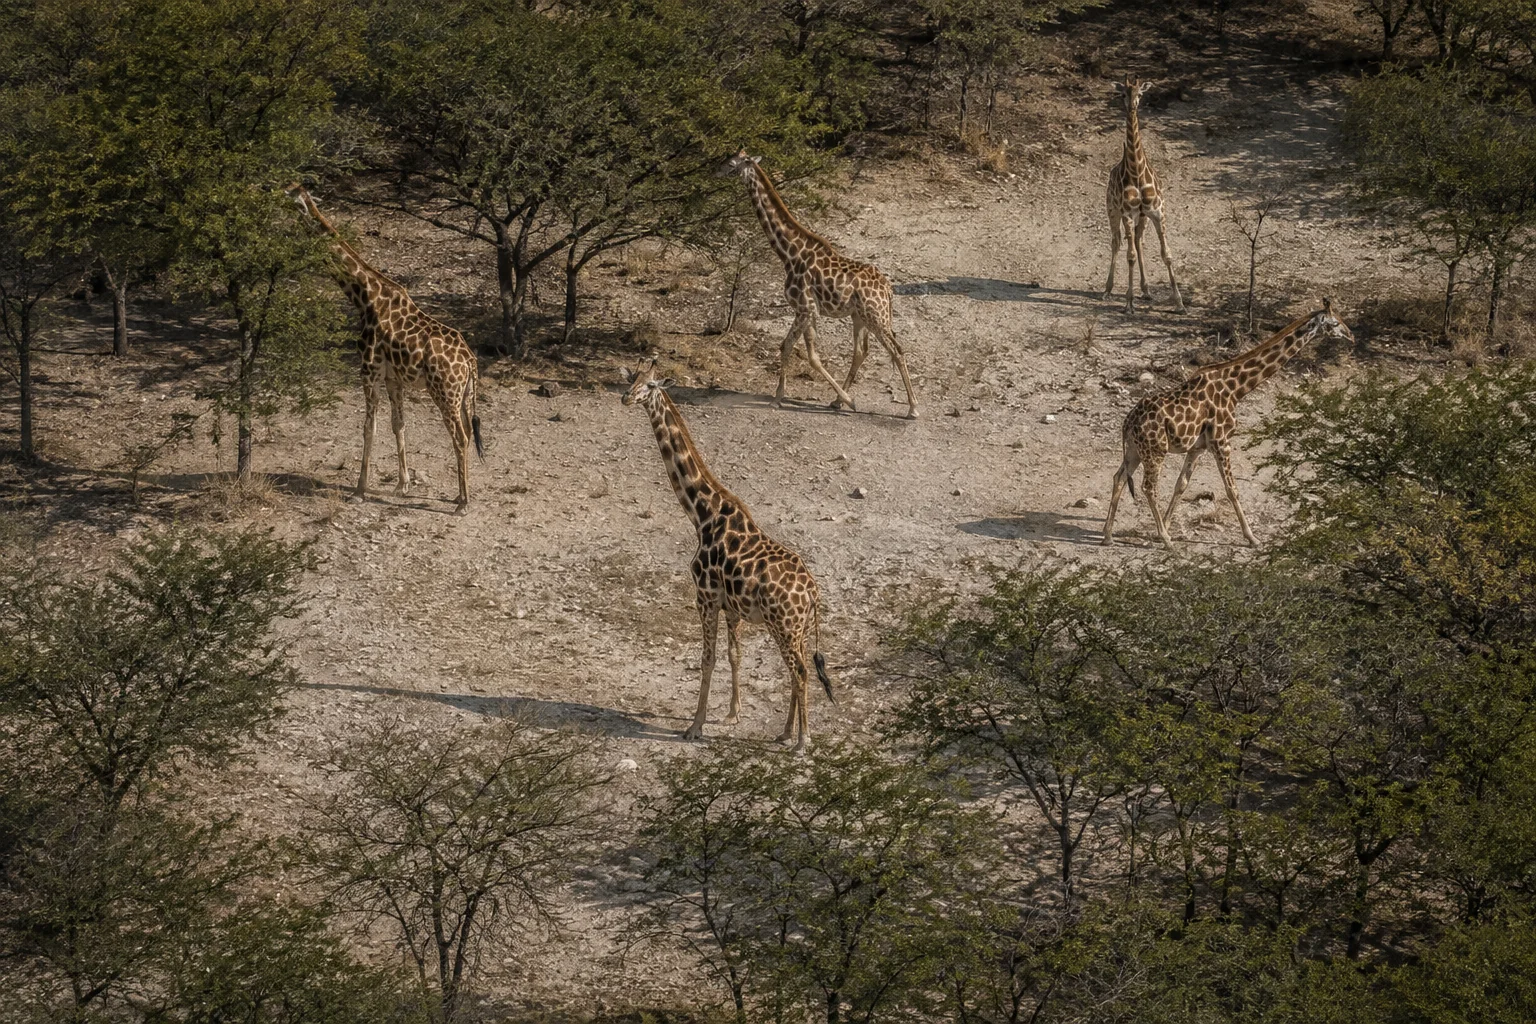
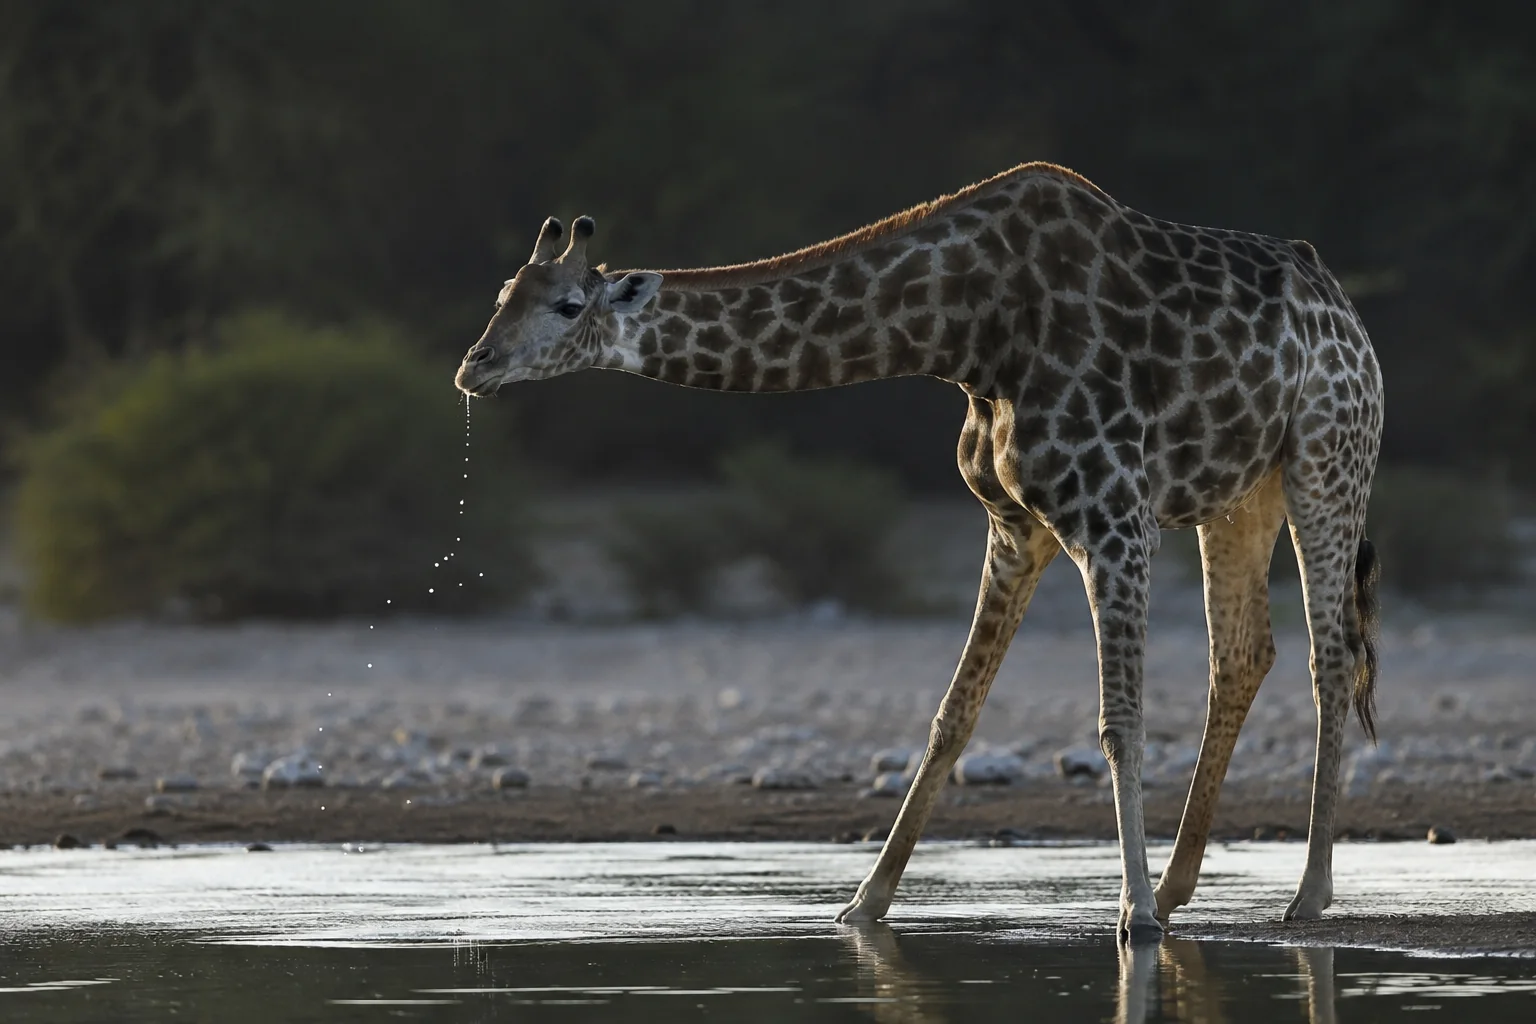
A waterhole can appear to offer a simple way to count giraffes. Cameras watch a limited number of places, and thirsty animals come to them. But a giraffe that drinks today may have little reason to return tomorrow. A second animal may visit another waterhole, and a third may appear repeatedly in hundreds of images. The resulting photographic record measures visits before it measures a population.
Christophe Bonenfant, Ken Stratford and Stéphanie Périquet used that problem as the basis of a study published in 2023. At Ongava Game Reserve in Namibia, they compared several abundance estimators using the same camera survey. Their question was unusually revealing: how much could the answer change without collecting a different set of pictures?
The estimates ranged from 87 to 215 giraffes. The team’s preferred reference, which used repeated sightings of recognizable animals, was about 104. A model could therefore produce a number below the 101 animals actually identified, or more than twice the reference estimate. The choice of analysis had become a conservation issue in its own right.
Three weeks at the available waterholes
The study took place in September 2016, during Ongava’s dry season. In this roughly 300 km² fenced reserve, the researchers described 12 artificial waterholes as the available dry-season surface-water sources. They monitored all 12 for 21 days, with several cameras around each.
That setting helped define the population being estimated. The perimeter fence limited movements into and out of the reserve, and the short study period reduced the opportunity for births and deaths to change the population substantially. These features supported the use of a closed-population model: one that treats the population as remaining approximately the same while it is repeatedly sampled.
The cameras generated 30,913 giraffe images before records with incorrect time information were removed. Researchers matched individual coat patterns, aided by HotSpotter software, and used other images from an encounter when a single photograph was insufficient. Some pictures remained unidentifiable. The goal was a verified identity history rather than an automated tally of every giraffe-shaped object.
They recognized 101 animals. Giraffes appeared at 10 of the 12 monitored waterholes, with large differences in how many distinct individuals were photographed each day. Daily totals ranged from eight to 54. Those differences occurred within a three-week study of an approximately closed population; they could not reasonably be treated as alternating population crashes and recoveries.
Identity reveals the animals a camera missed
A capture–recapture model follows an individual through a sequence of observation occasions. For a camera study, “capture” simply means a usable photographic encounter. A giraffe seen on Monday, missed on Tuesday and seen again on Wednesday was alive during the missed occasion. Repeated patterns like this contain information about detection.
The Ongava models allowed that probability to differ between days and among individuals. They also considered sex and whether an animal had been photographed at a waterhole on the previous day. This last term was especially relevant to the biology: a recent drink might reduce the need to visit again.
The team estimated strong variation in daily detection. In one model it ranged from about 0.02 to 0.47 through the study. Having been seen the day before also reduced the chance of being detected the next day. The data therefore contradicted the convenient assumption that every giraffe had the same stable chance of appearing in a daily count.
The reference abundance estimate was 104 animals, with a 95% Bayesian credible interval of 101–109. This small correction above the 101 known identities suggests that the sustained photographic effort had encountered most of the population represented by the model.
It does not mean researchers secretly knew the true total was 104. They chose capture–recapture as the reference because it could represent the detection patterns visible in the data. A spatial version, which also used the arrangement of waterholes and movements among them, estimated 109, with an interval of 103–115. Even within the strongest method family, a different representation of space slightly changed the estimate.
Why a flattening curve can give the wrong answer
A seemingly simpler method starts by adding up new individuals. Early in a survey, almost every encounter may add an unfamiliar giraffe. Later, already known animals dominate. If the cumulative total levels off, a curve can be fitted to predict its eventual ceiling.
That ceiling is an estimate of the population, but it depends on the mathematical shape chosen for the curve. Bonenfant and colleagues tried two forms. One projected about 117 giraffes; the other projected about 175.
The paper’s Figure 2 shows why this is consequential. Both smooth curves follow the broad rise in identities, yet they continue upwards differently after the observations end. The difference between 117 and 175 is largely a difference in extrapolation, not a collection of extra giraffes seen by one observer.
Both curves also fitted the daily accumulation poorly according to the authors’ goodness-of-fit checks. The closer estimate was not automatically a dependable shortcut. A model that happens to land near a stronger reference in one dataset may still be describing the observation process inadequately.
There is a practical cost to this shortcut as well: an accumulation curve of individuals already requires the work of recognizing those individuals. The authors argued that, once those identities exist, keeping their full encounter histories in capture–recapture analysis is more informative than reducing them to a cumulative total.
Repeated counts do not contain all the same information
Another family of models, called N-mixture models, tries to separate abundance from detection using repeated counts at multiple sites. It can appear attractive because it may avoid the labour of recognizing every animal. But different versions represent different kinds of observation process.
The Ongava comparison applied models both to counts of distinct identified animals at each waterhole and to raw observations in which the same giraffe could appear repeatedly. The resulting estimates demonstrate why those inputs cannot be casually interchanged.
| Analytical approach | Estimated giraffes | What the comparison exposed |
|---|---|---|
| Reference capture–recapture | 104 | Retained identities and modelled several sources of detection variation |
| Two accumulation-curve models | 117 and 175 | Different curve shapes projected different numbers beyond the observed identities |
| N-mixture with one standard count formulation | 215 | Produced an estimate far above the reference |
| N-mixture allowing correlated detections | 124 | Accounting for animals being detected together brought the estimate closer |
| N-mixture applied to repeated raw observations | 87 | Produced an estimate below the number of identified animals |
The researchers connected these differences to unrepresented variation in detection and to non-independent observations. Giraffes travel in groups, so seeing one can increase the chance of seeing its companions. The same individual can also contribute to observations on multiple occasions. A model needs to distinguish those patterns from additional unseen animals.
This was an empirical comparison, not a proof that every N-mixture model fails. It showed that apparently reasonable formulations were much less forgiving than identity-based models in this particular dataset. The result supports testing a convenient estimator against an informative reference before relying on it for management.
A fixed camera is not a fixed chance of detection
The biological explanation is plausible, but it is not the only one. The team’s calculations suggested an average interval of roughly four to five days between waterhole visits for females and males. Giraffes could obtain some moisture from food, or use small sources not represented in the camera record. These were possible explanations for the observed visit pattern, not separately tested water budgets.
Equipment also mattered. Cameras could stop recording when batteries failed or memory cards filled. A giraffe could pass without triggering a usable image, and a photograph could be too dark or blurred for identification. The number of functioning cameras varied during the survey.
Those mechanisms lead to the same central warning: keeping sampling points in the same places does not guarantee constant detection. A falling daily count could reflect fewer giraffes, fewer working cameras, different drinking needs, or some combination. Only the first is a population decline.
A 2016 Tarangire comparison by Derek Lee and Monica Bond exposed a related problem at a larger geographical scale. Their repeated ground photographs produced significantly higher estimates than aerial surveys at three of four sites, with corrections that differed markedly among places. Tarangire changed the observation method; Ongava showed that substantial disagreement can remain when the underlying image dataset is held constant.
Reading the two together makes the difference between sightings and abundance concrete. A population estimate is not simply the final line of an image-counting exercise. It is an explanation of how the observed animals stand in for both observed and unobserved members of a population.
Testing whether a counting shortcut can travel
Ongava’s fenced boundary, short survey and dry-season water concentration made it a useful comparison. They also limit how readily its results transfer to open landscapes or wet seasons with many temporary water sources. Animals that never enter the camera network are particularly difficult to represent from waterhole records alone.
Repeating the comparison in another season could test whether the same preferred model remains dependable when water is less concentrated. Comparing waterhole histories with an independent, well-designed photographic survey would provide another check on animals seldom seen drinking. Neither exercise requires assuming beforehand that a larger estimate is more accurate.
The study’s useful result is the demonstrated value of individual histories. The researchers turned a large image archive into evidence about who appeared, who returned and how detection changed. That additional information made the population estimate more defensible—and made the weaknesses of simpler answers visible.
Sources
- Christophe Bonenfant, Ken Stratford and Stéphanie Périquet (2023). Counting giraffes: A comparison of abundance estimators on the Ongava Game Reserve, Namibia. Hystrix, the Italian Journal of Mammalogy, 34, 1–7. DOI; open manuscript.
- Derek E. Lee and Monica L. Bond (2016). Precision, accuracy, and costs of survey methods for giraffe Giraffa camelopardalis. Journal of Mammalogy, 97, 940–948. DOI; full paper.