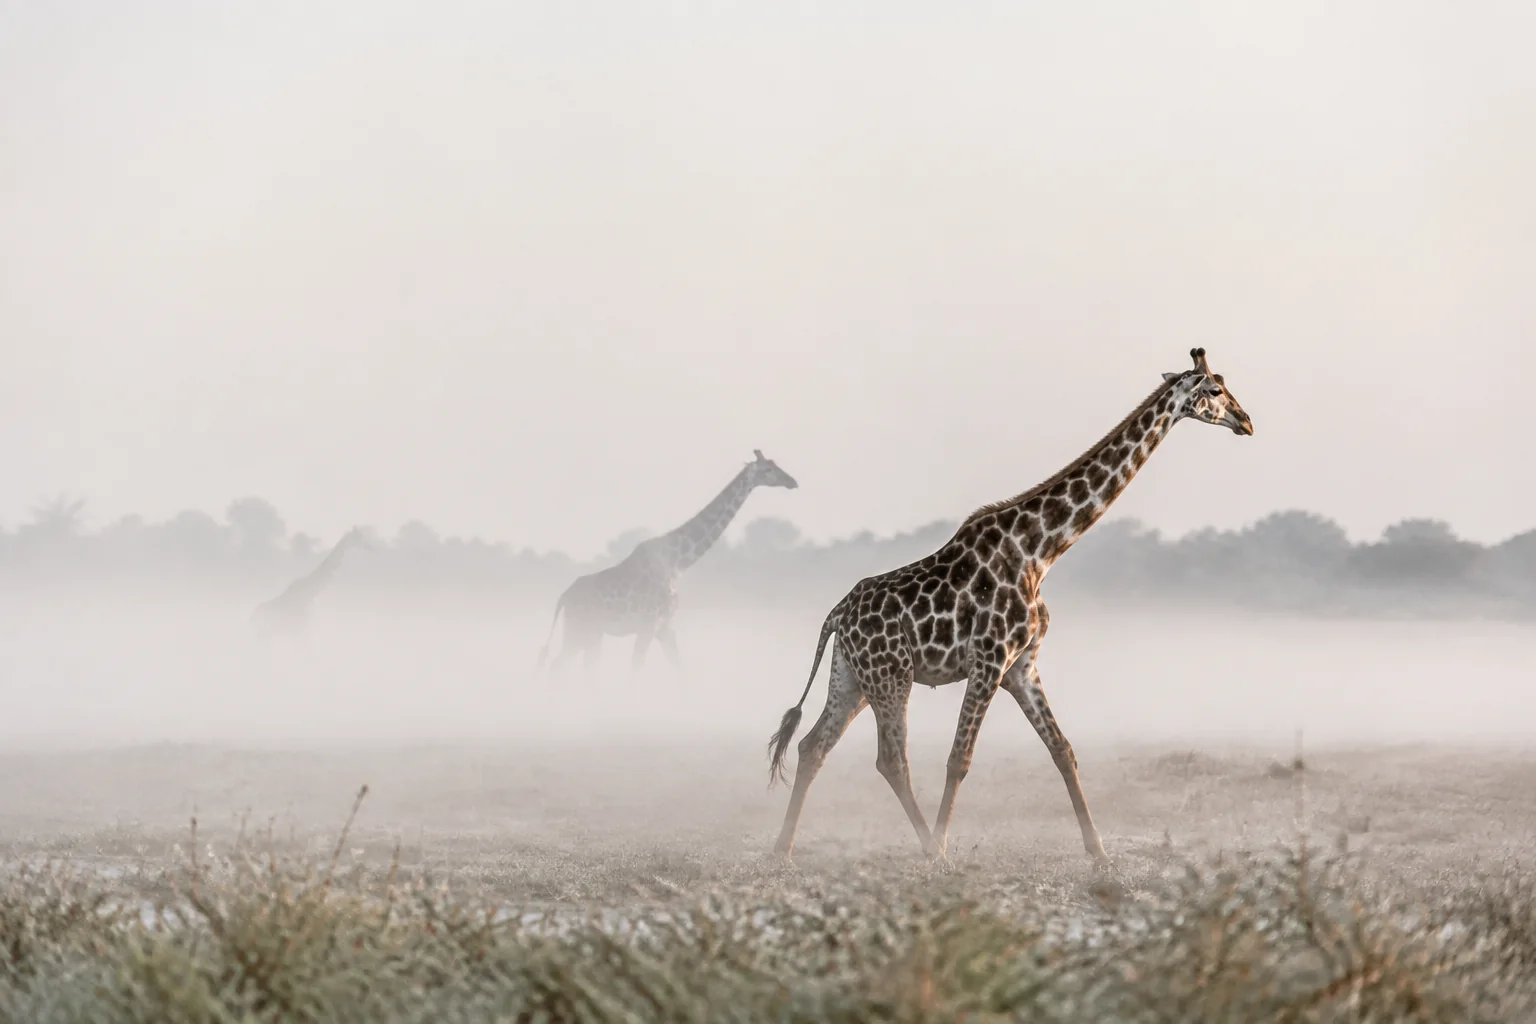
Giraffe taxonomy changes what gets counted as one conservation unit and what can disappear unnoticed inside a continental total. Yet DNA does not print a species name when it leaves a sequencer. Researchers must decide which animals to sample, which parts of the genome to compare and which model of population history to test—and those decisions explain much of the serious scientific disagreement.
What is the current giraffe taxonomy?
The public framework adopted by the IUCN SSC Giraffe and Okapi Specialist Group (GOSG) in August 2025 recognises northern, reticulated, Masai and southern giraffes as four species, with seven named subspecies among them. Our four-species guide is the place to compare those names, populations and identification limits.
The important word here is framework. The GOSG taxonomic assessment did not ask one genetic program to count species. Its task force used an integrative “Traffic Light” process that compared genetics, morphology and biogeography. A proposed taxon could be rated distinct when at least three correlated but independent lines of evidence supported it. The report also warned that repeated use of the same samples can make evidence look more independent than it is, and that drift, founder effects and population bottlenecks can mimic taxonomically meaningful separation.
The IUCN announcement of 21 August 2025 says the framework will guide future Red List assessments. It does not assign each new species an extinction-risk category. “Green” in the taxonomy report means strong evidence of distinctness; it does not mean the Red List category Least Concern.
What does a genetic study actually compare?
“The DNA evidence” can mean several very different datasets. Each is a partial record of ancestry, and each becomes informative at a different scale.
| Evidence type | What it follows | What it can reveal | What it cannot establish alone |
|---|---|---|---|
| Mitochondrial DNA | A largely non-recombining maternal line | Matrilines, geographic history and possible maternal introgression | The rest of an animal's ancestry or a species boundary by itself |
| Microsatellites or selected nuclear loci | Small chosen regions inherited through both parents | Population structure, shared alleles and modelled gene flow | A genome-wide history free from marker choice |
| Whole-genome data | Variation distributed across the nuclear genome | Broad ancestry, demographic history, inbreeding and competing evolutionary relationships | Every population, direct observations of mating, or a model-free species count |
| Skull shape and geography | Measured phenotype and spatial history, not DNA | Independent evidence that lineages differ and plausible barriers to exchange | A reliable diagnosis from one photograph or a substitute for genetic sampling |
Whole-genome evidence usually covers far more genetic variation than a panel of selected markers. That makes it powerful, not infallible. Fifty whole genomes may reveal more of the genome than hundreds of animals tested at a few loci, while still representing fewer individuals and localities. “More DNA” and “more complete geographic sampling” are separate strengths.
The same distinction matters within a species. The South Sudan Nubian giraffe study found regional genetic structure and retained diversity in a defined sample. That did not create a new species, count the population or demonstrate recovery.
How did the evidence move from markers to whole genomes?
The four-species case accumulated through studies with different designs. Reading the denominators prevents a familiar error: treating every animal named in a paper as if it contributed the same data to every analysis.
The 2016 multi-locus result
Fennessy and colleagues' 2016 study used mitochondrial sequences from 190 giraffes, while its seven nuclear introns represented 105 individuals. Its coalescent trees, clustering and other nuclear analyses supported four major groups under the authors' genetic-isolation criterion. The study also joined the former Rothschild's form with Nubian giraffe.
The paper was influential because it included all nine then-recognised subspecies in the nuclear comparison, not because 190 giraffes had complete genomes. Its mitochondrial and nuclear sample sizes answered related but non-identical questions.
Expanded markers and modelled gene flow in 2018
Winter and colleagues in 2018 expanded the nuclear comparison to 21 introns from 137 giraffes and the mitochondrial dataset to 217. Their analyses again recovered four major clades. Models estimated low long-term gene flow among them, and the BayesAss analysis did not identify any first- or second-generation hybrids in the sampled data.
Those outputs were not sightings of a fraction of a giraffe crossing a boundary. An “effective migrant per generation” is a population-genetic parameter inferred under assumptions about mutation, population size and migration. It describes the amount of exchange needed to produce the observed pattern under that model.
Whole genomes in 2021 and 2023
Coimbra and colleagues' 2021 whole-genome study analysed 50 giraffes from 17 localities representing all traditionally recognised subspecies. Population structure and phylogenomic analyses supported four separately evolving lineages with distinct demographic histories.
The scale of the inferred history changed. The 2016 selected-locus analysis estimated the main splits at roughly 1.25–2 million years ago; the 2021 genomic analysis estimated about 230,000–370,000 years. These are not direct dates read from fossils. They are outputs shaped by genomic regions, calibration choices and demographic models.
A 2023 Kenya-focused genomic study then combined 113 newly sequenced wild giraffes with 15 public genomes. It found strong separation among Nubian, reticulated and Masai giraffes while also detecting historical ancestry exchange. All reported 95% intervals for its estimated contemporary migration rates included zero, so recent exchange was not statistically demonstrated.
Our Kenya gene-flow commentary follows what each analysis can establish, why its sample changes and where the published methods need careful interpretation.
Why can maternal and nuclear histories disagree?
Mitochondrial DNA travels through mothers; most nuclear DNA recombines ancestry from both parents. If females tend to remain nearer their natal areas while males disperse farther, the two records can preserve different geographic histories. An old hybridisation event can also move a mitochondrial lineage across a population boundary, after which repeated backcrossing leaves little of the donor ancestry elsewhere in the genome.
Another possibility is incomplete lineage sorting. When populations divide, ancestral genetic variants do not instantly sort into tidy new branches. A mitochondrial tree or one nuclear locus can therefore group lineages differently from the relationship most of the genome supports.
These explanations must be tested; they are not excuses applied after any inconvenient result. The 2023 Kenya study, for example, compared nuclear and mitochondrial phylogenies, admixture graphs and migration models. It could support historical introgression without claiming that a mixed-species mating had been observed recently. That distinction is also why coat pattern remains a clue rather than a genetic diagnosis, as our coat-pattern science guide explains.
Why do studies support different species counts?
Species are evolutionary lineages, but no single measurement turns that general idea into an uncontested boundary. Researchers may emphasise fixed diagnostic differences, reproductive isolation, separately evolving populations, or the agreement of genetics with anatomy and geography. Methods also differ in how they represent gene flow and branching.
A 2020 reanalysis favoured three
Petzold and Hassanin's 2020 study reanalysed the 21-intron dataset from 137 giraffes using several phylogenetic, clustering and multispecies-coalescent methods, alongside 507 mitochondrial sequences. Under 16 STRUCTURE model combinations, preferred values of K varied; applying the authors' decision rules led them to favour three species.
That does not mean the sequences changed. Assumptions about correlated allele frequencies, admixture and how to choose K changed the interpretation. The authors also warned that some coalescent methods can delimit population structure rather than species.
A 2024 study replaced a simple tree with a network
Bertola and colleagues in 2024 assembled whole-genome data from 90 wild giraffes across 29 localities. After quality and relatedness filtering, their population-structure analyses retained 78 giraffes from 27 localities. They found strong genetic differentiation together with substantial ancient gene flow. Several analyses suggested that reticulated giraffes derived ancestry from both the northern lineage and an ancestral lineage related to Masai and southern giraffes.
Multiple admixture graphs fit similarly well, so the authors could not locate or time the exchange precisely or decide whether it occurred in one pulse. The study did not make differentiation disappear. It showed that a branching tree can be an incomplete picture when lineages split and later exchange genes.
A 2026 male-lineage analysis argued for two
A study published after the GOSG assessment added a new type of comparison. Hassanin and colleagues' 2026 analysis assembled four genes from the male-specific Y chromosome, three X-chromosome homologues, mitochondrial genomes and 21 autosomal introns from genomic data for 123 male giraffes. The authors interpreted their results as support for two species, with northern and southern groups and finer geographic divisions within them.
As checked on 7 September 2026, the public GOSG framework remains four species. The later paper should neither be hidden nor presented as if it automatically reversed an authority assessment that preceded it. It is new primary evidence for the standing task force and wider research community to evaluate alongside genome-wide, morphological and biogeographic work.
How should you read sample sizes and model outputs?
Four questions make a genetics claim much easier to audit:
- What was sampled? Count individuals, populations and geographic coverage separately. Note whether zoo animals, translocated populations or close relatives were included or filtered.
- Which inheritance record was measured? A mitochondrial haplotype, several nuclear loci, a Y-chromosome sequence and millions of genome-wide variants do not trace the same history.
- What did the model assume? Check the proposed number of ancestry groups, treatment of gene flow, mutation rate, calibration dates, population-size changes and whether a branching tree was assumed.
- What observation could distinguish alternatives? Wider sampling, independently inherited markers, known-provenance animals or a model that includes migration may separate competing explanations.
Sample size is therefore about representation as well as arithmetic. Adding many animals from one well-sampled population cannot fill a gap elsewhere. Conversely, a small number of complete genomes can test questions that hundreds of short sequences cannot. The strongest inference comes when different evidence types converge across representative samples—and when residual uncertainty is reported rather than edited away.
What can taxonomy decide for conservation?
Taxonomy defines the biological units an authority recognises. It can change how abundance, range and threats are organised, but it is only one layer of a conservation decision.
Taxonomy is not threat status
A Red List assessment evaluates extinction risk for a named unit using population trend, distribution and other criteria. The 2025 taxonomy decision prepares the units for assessment; it does not calculate their categories. The current distinction and dated labels are tracked in our giraffe endangered-status guide.
Species are not the only management units
Populations within the same species may be isolated, locally adapted, founded by few animals or affected by different threats. Managers may need to monitor or plan for such populations separately without declaring each one a species or subspecies. Genetic structure can flag a question; demographic evidence, provenance, habitat and feasible long-term monitoring determine what that question means on the ground. Our northern giraffe profile shows how one species label can contain several very different population histories.
Our Masai giraffe Rift-genomics commentary follows that distinction through one study, separating inherited population structure from evidence of contemporary movement.
Genetics does not authorise a move
For a proposed giraffe translocation, genetics can help clarify ancestry, relatedness and which variation may be lost or mixed. It cannot by itself show that the destination is suitable, that the source can sustain removals or that the move will establish a persistent population. Genetic relatedness also does not test pathogens: disease and welfare require their own evidence, described in the veterinary conservation guide.
The conservative implication is to preserve traceable diversity and investigate before mixing lineages—not to prescribe “genetic rescue” whenever a sample looks isolated. The genetic-isolation research area provides further primary literature for readers who want to follow those distinctions.
What to remember
- The GOSG's August 2025 framework recognises four giraffe species and seven subspecies using genetics, morphology and biogeography together.
- Mitochondrial, Y-chromosome, selected nuclear-locus and whole-genome studies recover different parts of ancestry.
- Samples, geographic coverage, species concepts and model assumptions help explain why published studies support different boundaries.
- Historical gene flow can coexist with strong present-day differentiation; it is not proof of recent movement or unrestricted interbreeding.
- Taxonomic units, Red List categories and management populations must not be substituted for one another.
- Genetics informs conservation decisions, but it cannot alone diagnose disease, prove habitat suitability or justify a translocation.
Frequently asked questions
How many giraffe species does the IUCN specialist group recognise? The GOSG framework adopted in August 2025 recognises four. A 2026 primary paper proposed two, but that later interpretation is not the public GOSG classification as checked on 7 September 2026.
Does finding gene flow mean two giraffe groups are one species? Not automatically. The timing, amount, direction and distribution of gene flow matter, as does the species concept being applied. Distinct lineages can retain evidence of ancient exchange.
Is a genetic cluster the same as a species? No. Clustering programs partition variation under specified models. Geographic population structure, sampling gaps and the chosen value of K can all create or merge clusters without deciding formal taxonomy.
Can you identify a giraffe species from its spots? A coat may provide a field clue, but photograph conditions, individual variation, contact zones and translocation history limit certainty. The 2025 GOSG assessment did not use pelage to decide its species framework.
Sources
Sources were checked on 7 September 2026. The authority sources are the IUCN SSC GOSG taxonomic assessment, announcement and current specialist-group page. Primary studies linked beside the relevant claims are Fennessy et al. (2016), Winter et al. (2018), Petzold & Hassanin (2020), Coimbra et al. (2021, 2023), Bertola et al. (2024) and Hassanin et al. (2026).
These studies do not all ask the same question or support the same delimitation. Sample numbers have not been pooled, ancestry estimates have not been converted into observed movements, and no taxonomic result has been presented as an extinction-risk category or an automatic management prescription.