A patch of woodland can resemble the places giraffes use and still be a poor place to release one. It might be isolated among farms, exposed to hunting, or disconnected from the next patch of food. For a habitat map to help conservation, its users need to know both what the map recognizes and what it leaves out.
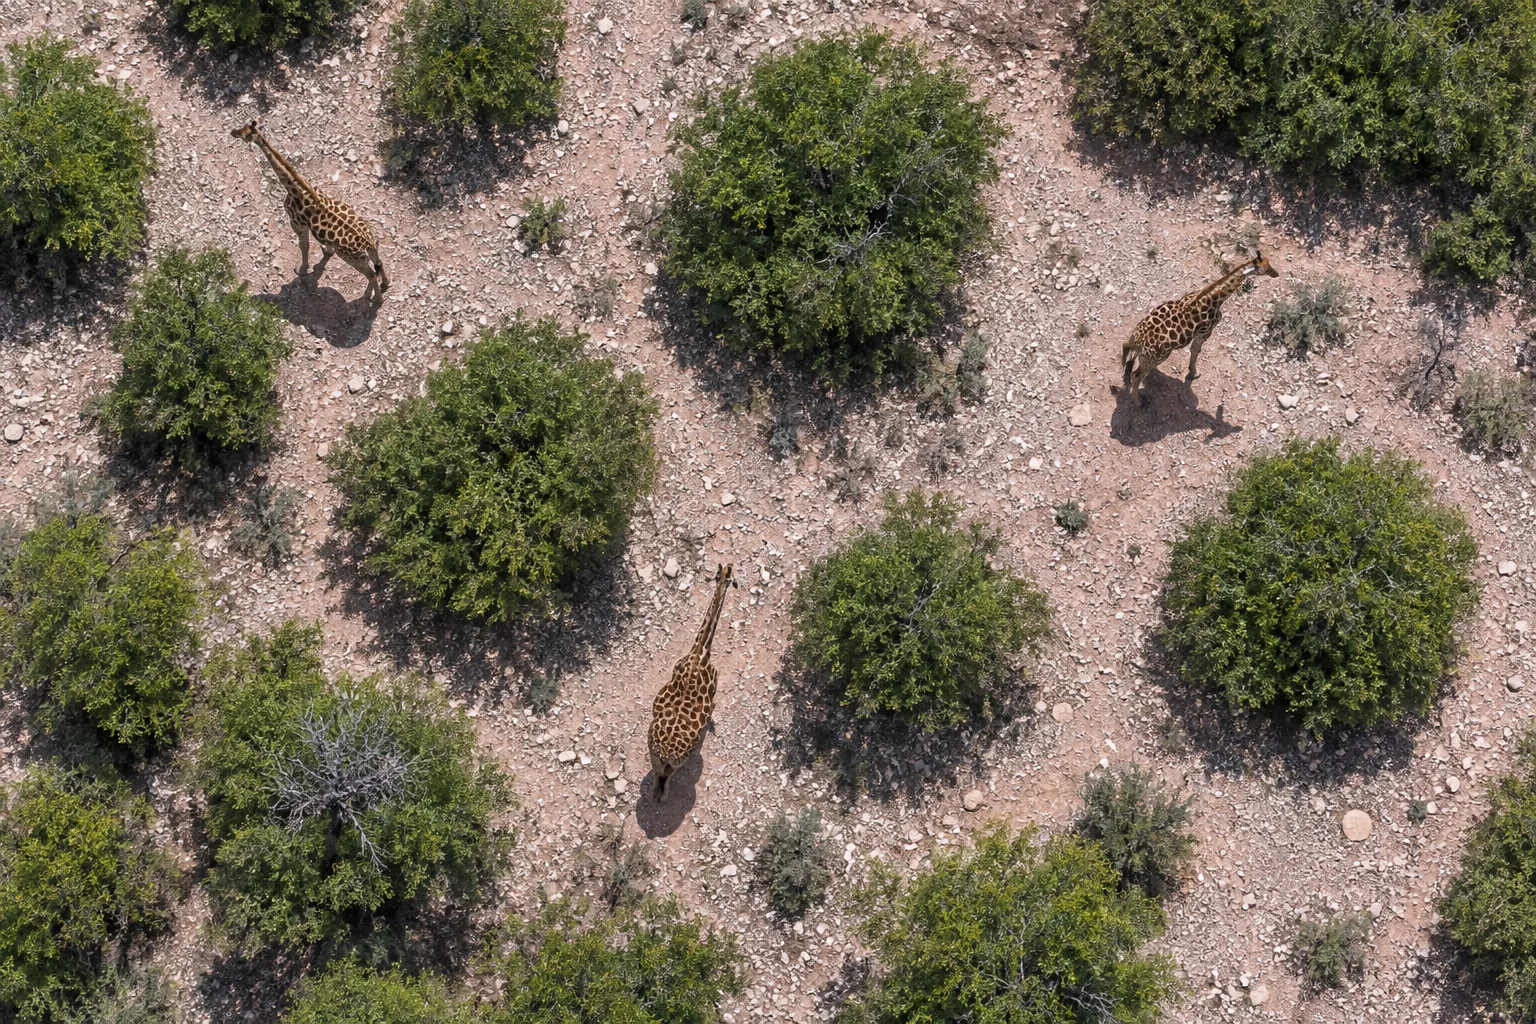
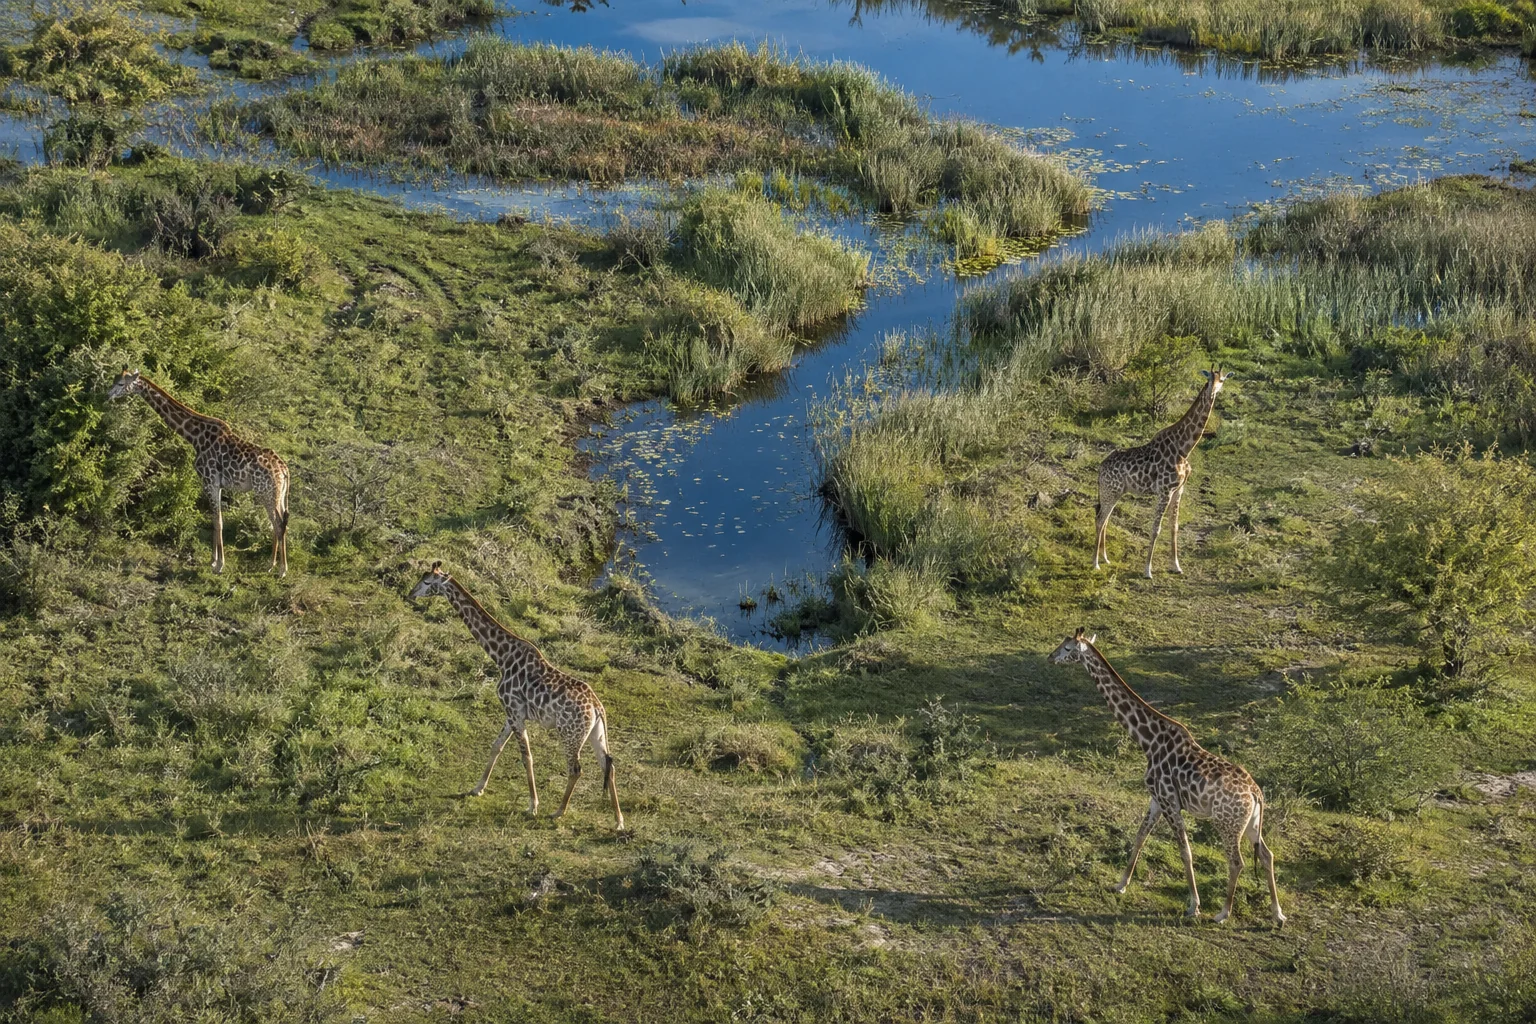
Ramiro Crego and colleagues combined GPS records from 31 reticulated giraffes with satellite imagery to predict potential habitat across a much wider region of Kenya, Ethiopia and Somalia. Their study produced 30-metre habitat predictions that could help direct surveys toward undersampled areas and inform assessments of possible translocation sites.
The initial model checks were encouraging. Independent observations supplied a more complicated picture: giraffes generally occurred in places rated more suitable than random locations, but some measures of predictive performance weakened substantially. That difference is central to the discovery. Detailed satellite mapping can make a large landscape more searchable without establishing that every apparently suitable patch can sustain giraffes.
Learning the landscape from 31 animals
The telemetry data came from giraffes fitted with GPS devices in central and northern Kenya during 2019–2020. Tracking duration varied greatly, from eight to 462 days, averaging 209 days per animal. The devices recorded frequent positions, giving researchers a detailed account of where these particular giraffes went.
Frequent positions also repeat information. An animal that remains near the same trees can produce many nearly identical fixes, and an individual tracked for a long time can dominate a dataset. The team reduced this repetition by selecting one location per animal per day and retaining only one observation within each 30-metre map pixel. After filtering, 5,778 occurrence points remained.
The satellite layers described the land around those points. Landsat imagery supplied information about reflected light, vegetation greenness, bare ground and variation through time. Radar data added information associated with woody vegetation. An elevation-derived layer described how rugged or smooth the terrain was.
The study did not count giraffes directly from space. Nor did a satellite identify the exact plant species each giraffe ate. Instead, the model learned combinations of environmental measurements associated with the locations used by the tracked animals. It then searched for similar combinations elsewhere.
This approach offered more spatial detail than broad climate layers alone. It could distinguish small patches and transitions within a landscape that might otherwise be treated as one large block of habitat.
The comparison was presence against background
To learn what distinguished the tracked locations, the analysis needed comparison sites. The team generated “pseudo-absences”: locations selected as background examples rather than places where exhaustive surveys had demonstrated giraffes were absent.
This terminology can obscure a major distinction. A background point might contain suitable habitat or even an unrecorded giraffe. It is useful for describing the environmental contrast in the available data, but it is not verified evidence of absence.
The model used a random-forest classifier, which combines many decision trees to recognize patterns among the environmental variables. Training and evaluation were separated using 10-kilometre spatial blocks. That was intended to reduce the easy success a model could achieve if nearly adjacent records from the same area appeared in both sets.
The researchers repeated the procedure five times and averaged the predictions. They also mapped variation among the five outputs. Agreement among those models indicated consistency under those data partitions. It did not guarantee that all five were correct in a distant habitat poorly represented by the tracked giraffes.
A useful prediction met a harder test
The initial spatial validation gave an average area under the precision–recall curve of 0.88. This metric describes how effectively the model distinguishes recorded occurrences from comparison points across different decision thresholds. On the study’s balanced datasets, 0.5 provided the stated random baseline. A value of 0.88 therefore suggested useful discrimination within that evaluation.
The authors then asked whether the model also worked with observations that had not supplied the tracking data. They used 36 checked citizen-science records from 2019–2020 and 335 giraffe records from a 2015 aerial survey. For the older observations, they generated predictions using satellite imagery corresponding to that earlier period.
In both datasets, the average suitability at observed giraffe locations was higher than at random locations. The citizen-science observations averaged 0.61 against 0.49 for background points; the aerial observations averaged 0.51 against 0.41. These comparisons supported the idea that the model recognized some meaningful features of giraffe habitat.
The fuller performance measures were less reassuring. The average precision–recall score was 0.66 for the citizen-science data and 0.47 for the aerial dataset, compared with 0.88 in the original validation. The aerial result was below the study’s stated 0.5 baseline for a balanced comparison. Its sensitivity was 0.60, meaning that the chosen threshold classified about 60% of the recorded aerial occurrences as suitable.
These findings are not interchangeable. A higher average suitability at known locations can coexist with weak overall classification performance. The first asks whether the two sets differ on average; the second asks how well the model separates their individual members. Reporting only the favourable average comparison would hide an important limit on transferring the model to another dataset.
The authors suggested several possible explanations, including the broader area covered by the aerial records and the possibility that giraffes sometimes occupy poorer habitat under human pressure. Those possibilities were not directly tested. They help frame future investigation without resolving the weaker validation result.
Detail did not remove the sampling limits
All 31 tracked giraffes came from a relatively small part of the species’ potential range. They could not represent every combination of habitat, sex, social circumstances and individual space use across that range. A very large number of positions is still information from a limited set of animals.
The independent data had limitations too. Citizen-science records are not distributed uniformly, and aerial observations do not locate animals with 30-metre precision. The researchers buffered validation records to account for coordinate uncertainty before extracting predicted suitability. Their test was therefore more realistic than pretending every record identified a perfect satellite pixel.
A separate giraffe survey comparison in Tanzania showed why aerial records also need an observation-based interpretation: aerial abundance estimates were lower than photographic capture–recapture estimates in three of four areas after seasonal adjustment. That experiment does not calibrate the Kenyan aerial dataset. It does reinforce the difference between a landscape with no giraffe record and a landscape where giraffes have been shown to be absent. Our survey-method commentary explains the distinction.
The habitat study accordingly used pseudo-absences rather than claiming to possess a complete absence map. Its evidence supports prioritizing fieldwork, with particular care when predictions extend beyond the environments represented by the tracked animals.
How much potential habitat appeared?
Applying a threshold turned the continuous suitability map into areas classified as suitable or unsuitable. Within the study’s defined known and possible range areas, the model identified 5,519 square kilometres of potential habitat in Kenya, 963 in Ethiopia and 147 in Somalia. Additional predicted habitat lay within the surrounding buffer examined by the researchers.
These are model-derived areas for the environmental data and range definitions used in the study. They are not measurements of occupied giraffe range, legally protected land, or habitat confirmed to be available for translocation. The threshold also matters: drawing a binary boundary turns a continuous gradient into a planning category, so the totals depend on that analytical choice.
The value of the map was its ability to identify patterns and candidate areas that could be investigated. A country total alone cannot show whether patches are connected, whether animals can cross between them, or whether people living and working in those landscapes support a proposed conservation action.
The pressures a green pixel cannot explain
Bare ground and vegetation greenness ranked among the more influential predictors, alongside reflected blue light and terrain ruggedness. No single variable overwhelmingly dominated the model. These associations describe predictive usefulness; they do not establish the causal reason giraffes used a location.
The authors included bare ground partly as an indirect signal of livestock pressure. They did not directly measure all the pressures relevant to habitat. Predators, competition, illegal hunting and road traffic were among the missing factors they identified.
Their own figure comparing a fragmented agricultural landscape with the model output illustrated the practical consequence. A small patch could receive a relatively favourable score while sitting within a wider human-dominated matrix that giraffes would be unlikely to use. Pixel-level resemblance to habitat does not establish landscape-level accessibility or safety.
For that reason, the paper called for field validation and site-specific assessments before moving animals. A valuable follow-up would test predictions in remote areas and environments unlike the tracking sites. Another would compare mapped suitability with actual survival and reproduction after any independently justified release. Those measurements would ask whether a location merely resembles used habitat or supports a persistent population.
The map’s contribution was to narrow the search intelligently. Its independent checks showed why the search still had to continue on the ground.
Sources
Crego, R. D.; Fennessy, J.; Brown, M. B.; Connette, G.; Stacy-Dawes, J.; Masiaine, S.; and Stabach, J. A. (2024; published online 2023). “Combining species distribution models and moderate resolution satellite information to guide conservation programs for reticulated giraffe.” Animal Conservation, 27, 160–170. Paper and DOI. Full paper.
Lee, Derek E., and Bond, Monica L. (2016). “Precision, accuracy, and costs of survey methods for giraffe Giraffa camelopardalis.” Journal of Mammalogy, 97, 940–948. Paper and DOI.