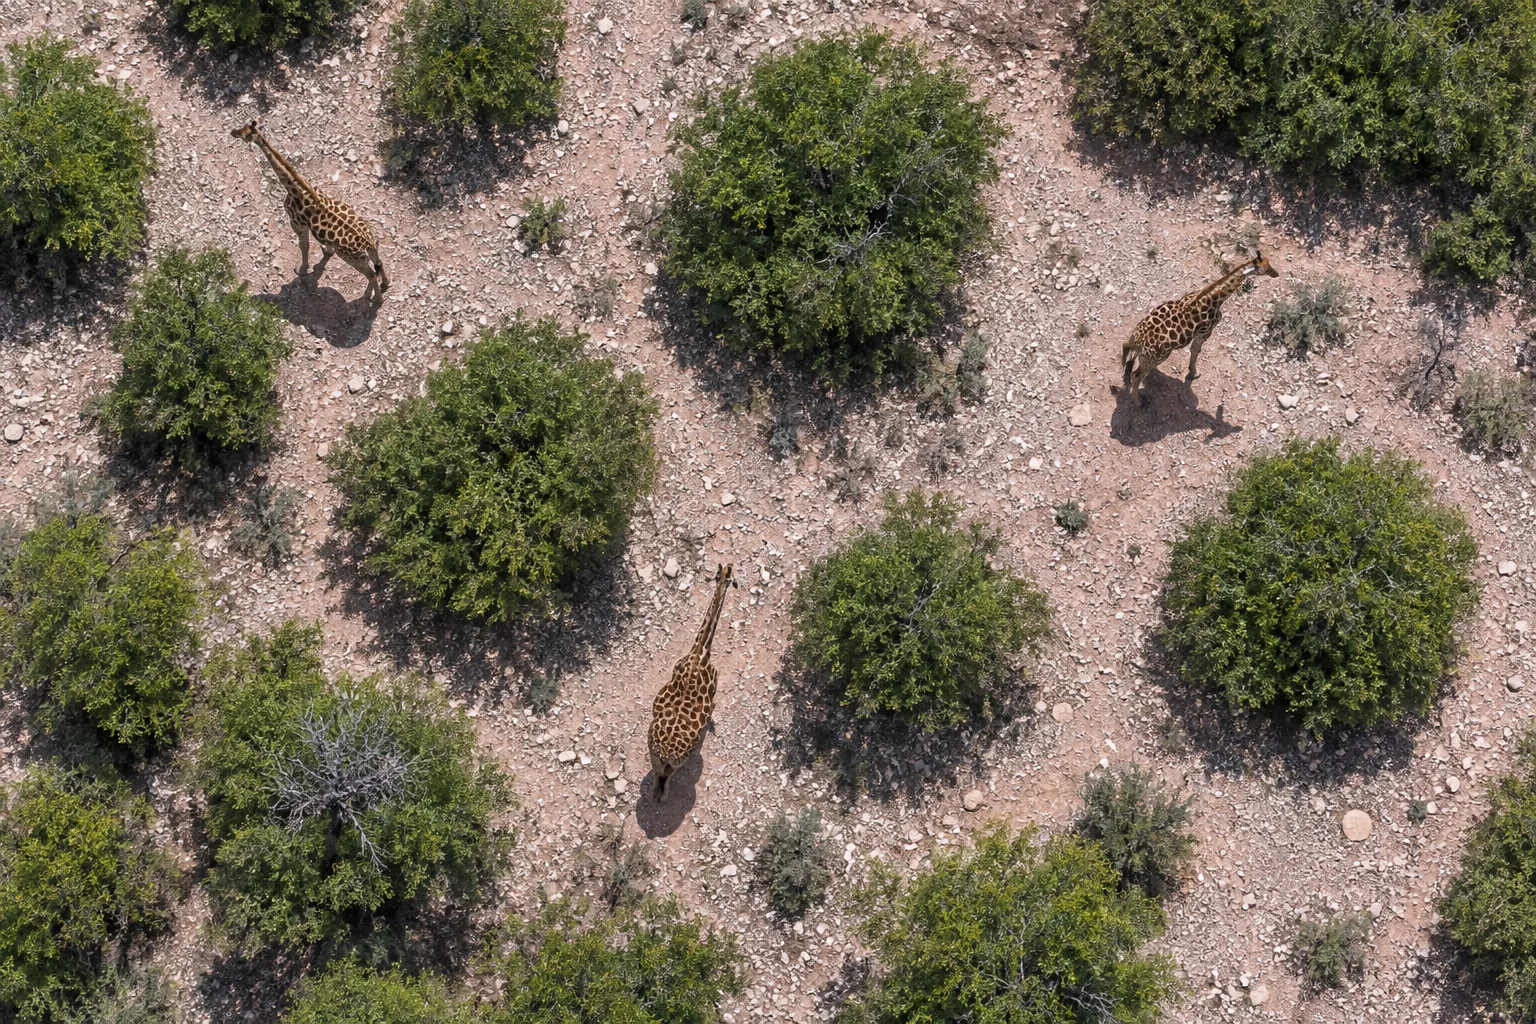
National park boundaries are easy to draw. The habitat a giraffe needs is less obliging. Food, shelter and the possibility of reaching another suitable area can extend through land owned and used by people.
A 2024 study led by Amos C. Muthiuru examined that wider picture in the Tsavo–Mkomazi landscape of Kenya and Tanzania. By combining giraffe sightings from an aerial survey with satellite-derived environmental information, the team estimated where habitat might be suitable and how those areas might connect.
The model identified approximately 15,000 square kilometres of potential habitat, with roughly 17% in community ranches. Its predicted connections gave those lands a role that would be easy to miss on a map focused only on national parks.
The study did not track giraffes travelling along those connections. Understanding that difference is essential to understanding both the promise of the map and what remains to be established on the ground.
Starting with giraffes seen from an aircraft
The observations came from a seven-day aerial wildlife census in June 2021. Aircraft flew systematic routes while observers recorded sightings and their positions.
For habitat modelling, the researchers began with 1,288 giraffe sighting records. These were occurrence locations, not 1,288 individually recognised animals followed through time. A sighting could represent a group, and the analysis did not reconstruct individual movements.
The team divided the landscape into 250-metre cells and retained only one occurrence within each cell. That reduced the dataset to 1,208 presence records and limited the influence of clustered observations in the same small area.
The cell size also allowed for uncertainty between where an animal was seen and where the aircraft was when its position was recorded. It did not make the original locations exact.
The next question was what those occupied cells had in common. The researchers assembled seven environmental predictors representing rainfall, vegetation, woody structure, elevation, terrain roughness and human modification. A statistical classifier learned to distinguish environments containing observed giraffes from a comparison set of background locations.
What the model learned—and what it did not
The comparison locations were pseudo-absences: places sampled for modelling because no giraffe presence record occupied that cell. They were not all places where repeated searches had proved giraffes absent.
That distinction matters in aerial surveys. Animals can be missed, and one week's survey cannot describe every place they use throughout a year. The model therefore estimated environmental suitability from a snapshot of recorded presence and a constructed comparison, rather than deriving a definitive inventory of occupied and empty habitat.
To assess its predictions, the team divided the landscape into spatial blocks and repeatedly held some blocks back from model fitting. Testing on withheld areas is more informative than asking whether a model can reproduce the records it has already seen.
The resulting precision–recall performance measure averaged 0.80. That indicates useful discrimination in the study's validation exercise; it does not mean that every pixel had an 80% chance of containing a giraffe or that a predicted corridor was 80% certain to function.
The strongest predictor was a composite human-modification index. Rainfall and elevation followed. Vegetation and terrain variables also contributed.
A predictor's importance means it helped the model distinguish the recorded environments. It does not establish a causal effect or identify the intervention that would change giraffe use.
Why the human footprint needs unpacking
The human-modification layer combined settlements, agriculture, livestock, roads and other infrastructure. It was useful because the landscape contains many overlapping forms of human activity.
Combining those activities also limits interpretation. If the index strongly predicts giraffe occurrence, the result does not tell us whether a road, cultivation, grazing or another component caused the association. The authors explicitly left the contributions of individual human activities outside the study's scope.
The original human-modification layer had a kilometre-scale resolution, and the rainfall layer was coarser still. Resampling them into 250-metre cells gave the model a common grid; it did not create new fine-scale measurements.
These details are consequential for land-use decisions. A regional model can highlight areas deserving closer investigation, but it cannot establish that a particular household, grazing practice or small road prevents giraffe movement.
Community ranches themselves were among the areas the model identified as valuable. The practical picture is therefore one of a mixed-use landscape whose different activities and contributions need to be understood locally.
From suitable habitat to a possible connection
The study's second step was to turn habitat suitability into movement resistance. The researchers assumed that more suitable habitat would generally be easier for giraffes to move through.
They then used methods analogous to electrical current flowing across a landscape, together with least-cost calculations, to identify potential connections among seven core areas. Routes passing through lower-resistance cells were treated as more permeable.
The analogy helps explain the output. Current can spread through several available paths, concentrate in a narrow connection or encounter a high-resistance barrier. A conservation map built this way can identify where the loss of one connection might matter more than the loss of an alternative route.
But the correspondence between feeding habitat and movement habitat is an assumption. A giraffe might cross an area it would rarely choose for prolonged feeding, or avoid a seemingly suitable place because of a barrier the model represents poorly.
The paper's connectivity map is consequently a set of predicted relationships, not a GPS record of travel. It shows where to investigate and what kinds of landscape changes could deserve attention.
What the map brought into view
The model identified Tsavo West and Tsavo East national parks as the major habitat areas. It also placed about 2,600 square kilometres of potentially suitable habitat in community ranches, roughly 17% of the total.
The predicted network made some of those ranches important because they linked multiple core areas. Their contribution was not simply the amount of habitat they contained, but their position within the wider network.
There was an additional geographic uncertainty. The aerial census used for the analysis had not covered Mkomazi National Park in Tanzania. Predictions there extended the model into a connected but unsurveyed part of the landscape. They require field validation, rather than being treated as new observations from Tanzania.
The June survey also represented one season. The analysis could not establish how the network changed when rainfall altered forage elsewhere. Repeated seasonal observations could reveal useful areas missing from this particular snapshot.
A priority map becomes useful through follow-up
The authors noted that roads, railways and other linear infrastructure cross the landscape, but their analysis did not directly measure how individual giraffes negotiated those structures or used crossing provisions.
That is a natural next step. Observed crossings, repeat photographic records and tracking can test whether predicted links carry animals. Local knowledge can clarify land uses and barriers that broad environmental layers miss.
A separate photographic study in Tarangire demonstrates why that additional evidence matters. It measured exchanges among management areas using identifiable female giraffes and showed that similar local densities could conceal very different demographic contributions. The Tsavo model provides a landscape hypothesis; individual records can help determine how a proposed connection actually functions.
The conservation contribution of Muthiuru and colleagues' study is therefore specific and useful. It expands the area that planners should consider, brings community ranches into the habitat picture, and identifies candidate connections for investigation. Turning those predictions into effective conservation requires checking the movements, conditions and human relationships that make each connection work.
Sources
Amos C. Muthiuru, Ramiro D. Crego, Jemimah A. Simbauni, Philip M. Muruthi, Grace Waiguchu, Fredrick Lala, James D. A. Millington and Eunice W. Kairu (2024). “Human footprint and rainfall shape Masai giraffe's habitat suitability and connectivity in a multiple-use landscape.” Ecosphere 15:e4933. Full habitat-modelling study.
Derek E. Lee and Douglas T. Bolger (2017). “Movements and source–sink dynamics of a Masai giraffe metapopulation.” Population Ecology 59:157–168. Related study of observed exchanges.